Niseko Is Not One Property Market Anymore
Visible inventory expanded across Niseko in 2025, but recorded sales did not rise at the same pace. We map eight distinct submarkets and the different forms of value they offered.

Research Update: 30 July 2026
We thought we had finished digging. The data had other ideas.
After publishing the first version of this article, we completed a deeper review of the regional data and expanded the land analysis using the newly available plot-size splits.
The central conclusion has not changed—it has become stronger. The wider drive-to market was even more active than our first analysis showed. We have updated the figures, charts and structure of the series accordingly.
At first glance, 2025 looked like a year of expansion in Niseko's visible property market. Across Uchi's Niseko Area data, cumulative active inventory rose from 897 to 1,387 listings, an increase of 55%. Listings recorded as sold moved from 208 to 217, only 4% higher, while the average dated listing period lengthened from 297 to 305 days.
The Japan-wide Uchi rollup showed a similar pattern. Cumulative active inventory rose 64%, while listings recorded as sold rose just 4%. The important 2025 signal was therefore not a sudden acceleration in recorded sales, but a much larger menu of properties visible to a comparatively stable pool of buyers.
That imbalance gives buyers more choice and may create negotiating leverage, but it does not make every area cheap or every property easy to resell. The useful question is no longer simply whether Niseko is expensive. It is which form of value a buyer is paying for: observed turnover, resort convenience, drive-to space and privacy, apartment depth, land optionality or scarcity.
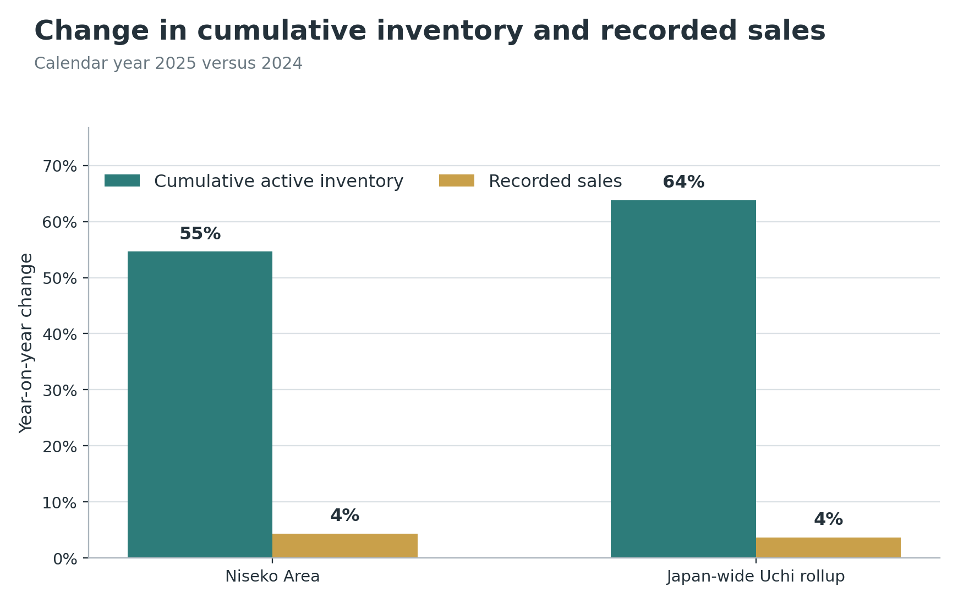
The headline gives buyers more choice—and potentially more leverage
Across Niseko Area, the median last known listing value of properties recorded as sold fell from ¥77m to ¥67m, a decline of 13%, even though indicative sold-listing value across all priced records marked sold rose 6% to approximately ¥26.47bn. More total value was represented among recorded sales while the middle of the sold-listing distribution shifted lower.
This is not proof that sellers discounted, because the data does not contain full asking-price histories or confidential final transaction prices. It is evidence that product mix and the centre of recorded sold-listing activity changed, giving buyers a reason to compare current stock with the kinds of properties that actually moved rather than relying on a single resort-wide average.
The 2025 value map
|
Area |
Active |
Sales |
Sold-listing median |
Avg days (coverage) |
Value lens |
|
Annupuri |
74 |
13 |
¥80m |
394 (13/13) |
Premium-positioned land |
|
Hanazono |
101 |
7 |
¥198m |
410 (5/7) |
Scarcity and delivered luxury |
|
Higashiyama |
83 |
4 |
¥90m |
93 (1/4) |
Delivered ecosystem, thin evidence |
|
Hirafu |
505 |
43 |
¥150m |
382 (38/43) |
Apartment depth and established
market |
|
Kutchan
Town |
128 |
43 |
¥45m |
251 (40/43) |
Turnover-supported value |
|
Moiwa |
49 |
5 |
¥65m |
223 (4/5) |
Early-stage house signal |
|
Niseko Town |
110 |
22 |
¥49.8m |
269 (22/22) |
Constructive middle tier |
|
Other
Niseko Areas |
337 |
80 |
¥55m |
288 (70/80) |
Wider drive-to value and choice |
* Higashiyama had valid sales-velocity dates for only one of four recorded sales, so its 93-day average should not be treated as an area-level speed signal. Other Niseko count metrics include parent-only records; its medians remain those of the separately classified cohort.
The first divide is observed turnover, not price
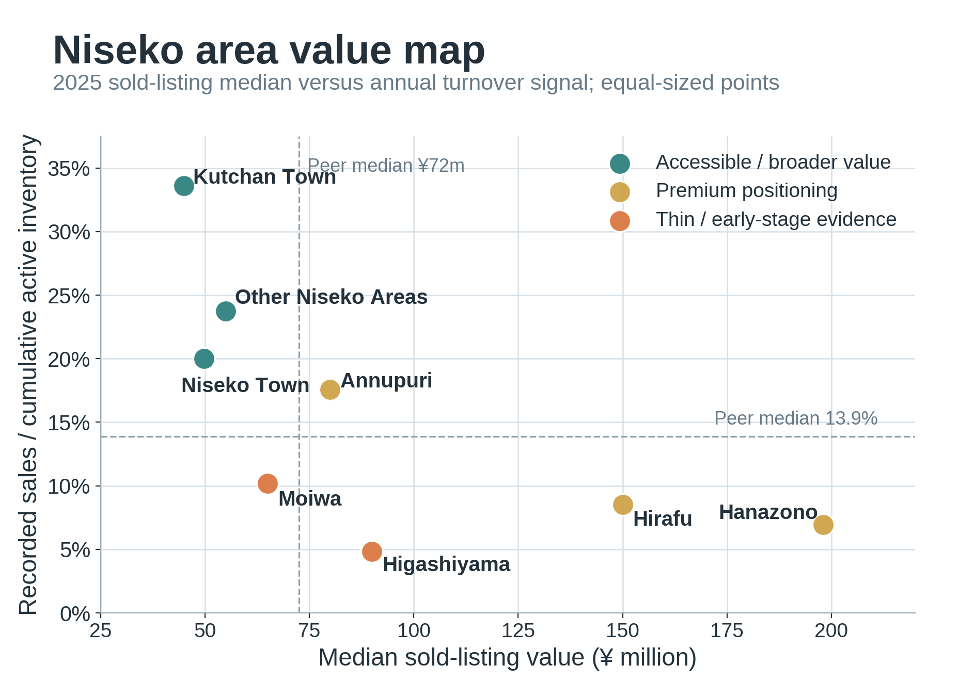
Hirafu and Kutchan Town each recorded 43 sales in 2025, but Hirafu carried 505 cumulative active listings while Kutchan carried 128. That does not make Kutchan more desirable or Hirafu weak. It means observed annual turnover relative to cumulative visible stock differed sharply. Hirafu carries more premium, development and specialist stock, while Kutchan has a broader local use case and lower entry prices. A buyer concerned with future resale should therefore examine asset class and local evidence rather than treating the Niseko name as a substitute for market depth.
After allocation of the parent-only Niseko records, Other Niseko Areas recorded the largest sales count among the eight peer areas, with 80, supported by 34 house sales and 43 land sales. Niseko Town also improved materially, with sales rising from 13 to 22. By contrast, recorded sales fell in Hirafu, Hanazono, Annupuri and Moiwa even as cumulative visible inventory increased in every area.
The second divide is product mix
An area-level median can move because comparable properties became more expensive, but it can also move because a different mix of land, houses, apartments and commercial properties appeared. This distinction matters in Niseko, where land dominates inventory in several areas while apartments dominate the price-per-square-metre conversation in Hirafu.
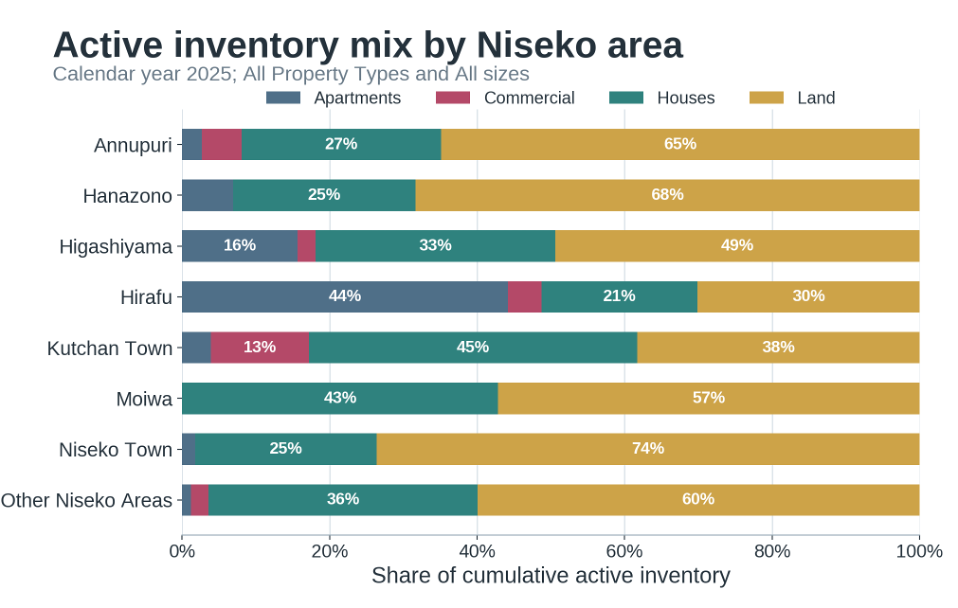
Hirafu's all-property active median increased only modestly to ¥207m, yet its apartment market remained a separate world: 223 active apartment listings, 21 recorded apartment sales, a median sold-listing value of ¥130m and a median sold-listing price of approximately ¥2.01m per sqm. In Hanazono, the median active apartment price reached ¥378m and the active median price per sqm reached approximately ¥4.42m, but Uchi recorded no apartment sales there in 2025. The asking signal was clear; the transaction evidence was not.
The eight-area read
Hirafu: the deepest premium evidence, but not uniformly fast
Hirafu remains the easiest premium area to analyse because it has the deepest apartment inventory, the largest set of apartment sales and the strongest body of comparables for buyers seeking an established market. The dated evidence nevertheless varies sharply by product: apartments averaged 363 days in the dated sample, houses 585 days and land 276 days. Those figures describe recorded listing histories, not a guarantee of future sale speed.
Hanazono: scarcity, delivered ecosystem and pipeline risk
Hanazono's 2025 all-property active median was approximately ¥299m, the highest among the eight areas, while only seven sales were recorded. Its current premium is supported by an operating international luxury hotel and residences, resort infrastructure and scarce product. The suspended Capella-led scheme should be treated separately as uncertain future optionality rather than as an amenity already delivered. Buyers therefore need to distinguish the value of the existing ecosystem from the price being asked for prospective development.
Annupuri: a lower-basis premium land option
Annupuri recorded ten land sales across the report-defined size cohorts. Small plots up to 1,000 sqm had a median sold-listing value of ¥29.5m and a median sold-listing price of approximately ¥39,000 per sqm, far below Hirafu's ¥60m and approximately ¥280,000 per sqm. The sites are not equivalent, but the pricing shows that recognisable resort positioning does not always require paying the full prime-area land premium.
Kutchan Town: the clearest turnover-supported house value
Kutchan Town recorded 21 house sales at a median sold-listing value of ¥38m, with an average of 177 days across the 20 sales that had valid dates. Its land and commercial markets also contributed meaningfully, making Kutchan less dependent on one property type and providing a broader observable resale pool than its resort-image ranking might imply.
Niseko Town: a constructive middle tier
Niseko Town's total sales rose 69% to 22, including nine houses, eleven land parcels and two apartments, while the all-property median sold-listing value was ¥49.8m. Its turnover ratio was below Kutchan's, but it showed a healthier combination of growing visible choice and growing recorded activity than most premium areas.
Other Niseko Areas: the wider drive-to market
Following allocation of parent-only records, Other Niseko Areas combined 337 cumulative active listings with 80 recorded sales and a classified-cohort median sold-listing value of ¥55m. Its 34 house and 43 land sales made it the broadest search pool in the peer set. This is not simply cheaper Niseko: in locations such as Kabayama, Soga and Kondo, buyers can exchange immediate walkability for more space, privacy, a lower price basis and a more individual home or development site.
Once a buyer is already prepared to drive in winter, the difference between a very short journey and a ten-minute journey may matter less than the saving in acquisition cost or the ability to use several resorts. Some locations offer practical access across Hirafu, Niseko Village, Annupuri or Hanazono; from more southerly areas such as Kondo, Rusutsu can also enter the calculation. The trade-off remains real: walkability is scarce and valuable, especially for rental guests and ski-school families, while road access, utilities, snow storage, topography and planning must be checked property by property.
Moiwa: an early-stage house signal
Moiwa's active house inventory rose from five to 21 listings, while three houses were recorded as sold compared with one in 2024. The 2025 house median sold-listing value was ¥62m and the dated average was 132 days. Those are encouraging directional signals, but three sales are not enough to establish a durable area-wide pattern.
Higashiyama: delivered ecosystem, thin resale evidence
Higashiyama's inventory rose 63%, but only four sales were recorded and only one had valid dates for the area-level calculation. The wider Niseko Village environment benefits from an operating resort ecosystem with international hotel brands and integrated amenities, but the Uchi resale sample remains too thin for a confident area-wide pricing or turnover conclusion. Direct property comparables remain more informative.
The 2025 evidence did not identify one universal value winner. Kutchan offered the strongest turnover-supported house evidence; Other Niseko Areas the broadest drive-to search; Niseko Town constructive middle-tier activity; Annupuri lower-basis premium land; Hirafu apartment depth; Hanazono delivered luxury scarcity with pipeline risk; Higashiyama delivered ecosystem but thin resale evidence; and Moiwa early-stage, long-dated optionality.
NEXT IN THE SERIES Part 2 examines observed turnover and why the wider drive-to market led Niseko by recorded sales.
Uchi Insights Series: The Niseko Value Map
- Niseko Is Not One Property Market Anymore (Free - Today)
- Where Niseko Property Actually Moved (Premium)
- The House Value Ladder (Premium)
- The Small Plot Premium (Premium - August 7)
- What The Brand Premium Buys (Premium - August 10)
Data note > Source: Uchi Annual Report regional rollups for calendar years 2024 and 2025, refreshed 28 July 2026. Active inventory is cumulative for the year. Values for records marked sold use the last known published listing price, not the confidential final transaction price. POA records are included in volumes but excluded from price metrics.