Japan’s Ski Towns Dominate Land-Price Growth—But What Does the Official Data Really Tell Us?
Japan’s fastest-rising residential land benchmarks are in Furano, Hakuba and Nozawa Onsen. We examine what the extraordinary rankings reveal—and what the official survey does not measure.

Japan’s fastest-rising residential land benchmark is not in Tokyo, Osaka or another major city. It is beside one of the country’s best-known ski resorts.
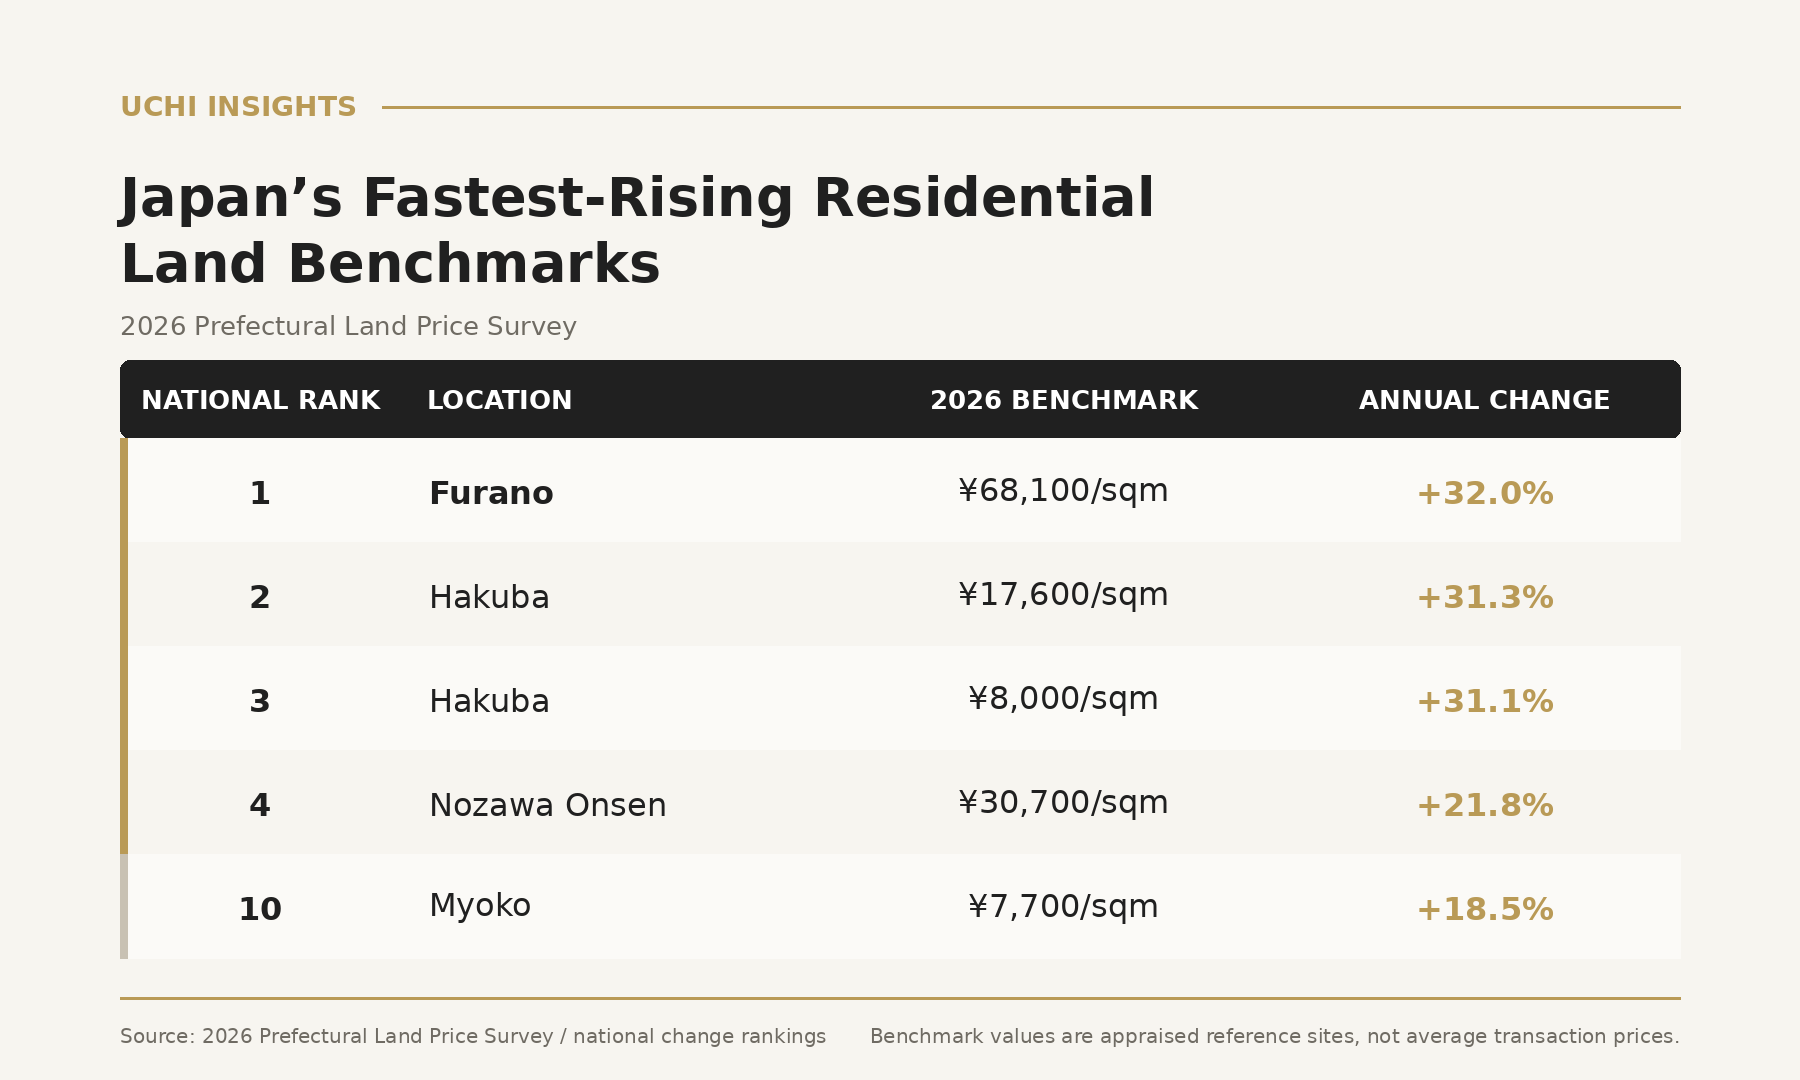
The latest Prefectural Land Price Survey, measuring values as of 1 July 2026, puts a residential benchmark in Furano’s Kitanomine district at the top of the national rankings, with an annual increase of 32.0%. The next two positions are both in Hakuba, at 31.3% and 31.1%, followed by Nozawa Onsen at 21.8%.
In other words, the four fastest-rising residential benchmark sites in Japan are all in mountain destinations. The pattern extends beyond residential land. Hakuba recorded the fastest increase in commercial land anywhere in Japan at 35.6%, while Nozawa Onsen placed second at 27.0% and another Hakuba benchmark ranked fourth at 25.9%. Myoko, meanwhile, appeared in tenth place nationally for residential growth, with one benchmark increasing by 18.5%.
That is an extraordinary concentration. It provides some of the clearest official evidence yet that the repricing taking place across parts of Japan’s mountain-property market is not merely a phenomenon visible on international real-estate websites. But it also demonstrates exactly why land-price statistics need to be read carefully.
We hope you are enjoying this free article and please continue reading on below. Uchi Insights provides the latest market news from across Japan as well as global mountain resorts, most of it for free.
But we'd love a little love!
If you want the latest data and deep-dive reports, you can access premium Uchi Insights covering pricing, sales, supply and market trends across Japan’s leading resort real estate destinations.
Twelve months of Premium access costs US$200—roughly the price of a good pair of gloves for that Japanese powder snow.
If you are buying, selling, investing or simply trying to understand where Japan’s resort property markets are moving, make sure you have the same data and analysis at your fingertips.
Don’t be the one wondering what everyone else knows.
The national context makes those numbers even more striking. Across Japan, residential benchmark land rose by an average of 1.0% during the year, commercial land by 2.9% and all land uses combined by 1.5%. All three measures have now increased for five consecutive years. In the Tokyo metropolitan area, residential land rose by 4.0% and commercial land by 8.9%—strong figures, but still far below the increases being recorded at individual mountain-resort benchmarks.
This does not mean that every piece of residential land in Furano became 32% more valuable in twelve months, nor that land throughout Hakuba appreciated by 31% and that distinction is essential.
What The Government Survey Actually Measures
Japan’s Prefectural Land Price Survey is an appraisal-based benchmark system rather than a census of every property transaction.
The 2026 survey covers 21,466 selected sites across Japan. Prices are assessed as of 1 July, with professional real-estate appraisers providing valuations from which prefectural governors determine the benchmark price. The purpose is to establish consistent reference points for analysing land-price movements and informing the wider property market.
The sites are therefore useful precisely because they can be observed repeatedly. If the same representative residential plot is appraised at ¥50,000 per square metre one year and ¥60,000 the next, the survey can identify a 20% movement without requiring that exact property to have changed hands.
What it does not tell us is that every nearby property has increased by the same percentage. A serviced plot close to a ski area, a large development site, agricultural land on the edge of a village and forest without practical winter access can all sit within the same broad destination while having radically different values.
That is especially relevant in resort markets, where location differences that appear small on a map can have significant economic consequences. Walkability, road access, utilities, snow storage, views, planning restrictions and proximity to existing resort infrastructure can materially change what land is worth.
The Furano Number Is A Good Example
The benchmark leading the national residential ranking is in Kitanomine, close to Furano Ski Resort.
The site is valued at ¥68,100 per square metre, up 32.0% from the previous year. Its surrounding area is described as a residential district containing houses and pensions close to the ski area. Separate reporting on the latest survey points to continuing demand associated with inbound tourism, second homes and accommodation for employees working in Furano’s growing hospitality sector.
That tells us something important about Kitanomine. It does not tell us that ¥68,100 per square metre represents the market price for every parcel marketed to an international developer in Furano.
A prime development site offered for a hotel or condominium project may transact—or be marketed—at a very different price. Large rural land several kilometres away may also sit at an entirely different level. The benchmark is therefore most useful as evidence of direction. It shows that a professionally assessed residential site close to Furano’s ski area has repriced very rapidly. That is a meaningful piece of evidence. Treating it as a universal Furano land price would go much further than the data supports.
Hakuba Provides An Even Stronger Signal
Hakuba is particularly interesting because several independent indicators are now pointing in the same direction. The government’s Hakuba-2 residential benchmark rose 31.3% to ¥17,600 per square metre, accelerating sharply from a 14.5% rise a year earlier. Another Hakuba residential benchmark increased by 31.1%.
The Ministry of Land, Infrastructure, Transport and Tourism specifically attributes the movement to strong demand for second homes and condominiums from affluent Japanese and overseas buyers, alongside continuing domestic and international capital flows. It says that demand around the resort areas is now spreading into existing residential districts.
The commercial market is moving even faster. A Hakuba benchmark close to the railway station rose 35.6% to ¥32,000 per square metre—the fastest commercial land-price increase recorded anywhere in Japan. MLIT points to increased tourism, hotel development and demand for land suitable for shops and accommodation.
That official evidence is particularly notable when placed alongside Uchi’s own marketplace data. In Uchi Japan’s 2025 dataset, Hakuba recorded the strongest increase in average land asking price per square metre of any market analysed, rising 60.6% year on year. Houses and commercial property also recorded substantial increases.
Those two percentages should not be compared directly. The government figure follows the appraised value of specific benchmark locations between July 2025 and July 2026. The Uchi figure measures the average asking price per square metre of land offered to buyers through our marketplace during 2024 and 2025. The mix of properties available for sale changes from year to year, while asking prices are not the same thing as completed transaction prices.
But the fact that two fundamentally different datasets are pointing in the same broad direction matters. Hakuba does appear to be repricing rapidly. The question is not whether the government figure or the marketplace figure is the “correct” one. They are answering different questions.
Price Growth And Price Level Are Not The Same Thing
The rankings also illustrate another distinction that often gets lost when discussing resort property: the market with the fastest percentage growth is not necessarily the most expensive market.
Hakuba’s benchmark increases exceed 30%, yet one of those residential sites is still valued at only ¥8,000 per square metre. Meanwhile, Uchi’s 2025 marketplace data shows Niseko-Hirafu continuing to lead Japan’s resort land market on outright asking price, at an average of approximately ¥291,000 per square metre and a median of ¥227,000 per square metre.
Again, these are not like-for-like measurements. The Hirafu figures represent the land actually offered through Uchi, including expensive resort and development sites, rather than one government benchmark.
But the contrast makes an important point. A market can rise extremely quickly because it is repricing from a comparatively low base. Another can record slower percentage growth while remaining dramatically more expensive in absolute terms.
This is one reason we have been cautious about describing Hakuba simply as “the next Niseko”. Hakuba increasingly has its own pricing structure, development pipeline and international buyer base. Rapid increases in land values may reflect genuine demand and changing expectations, but they also mean the old assumption that Hakuba automatically offers inexpensive land relative to established Japanese resorts requires much closer examination.
Nozawa Onsen Is Different Again
Nozawa Onsen provides another useful example. Its residential benchmark ranked fourth nationally with a 21.8% increase, while its principal commercial benchmark rose 27.0%—the second-fastest commercial increase in Japan.
Yet Nozawa is not developing in the same way as Hakuba. Its real-estate market is exceptionally constrained by geography, the historic village structure and the limited amount of property that reaches the open market. Uchi’s own research has repeatedly shown why visible listing counts provide only a partial view of activity there.
The official benchmark therefore adds something valuable. It provides a consistent reference point in a destination where conventional marketplace data can be unusually thin. At the same time, a rising benchmark cannot resolve the scarcity problem. Finding a willing seller, a usable property and a price supported by the asset itself remains a different exercise from observing annual movement at a government reference site.
And Myoko Has Entered The National Top Ten
Myoko is also worth watching. One residential benchmark in Myoko recorded an 18.5% annual increase, placing it tenth nationally. That sits alongside a much larger development story underway across the region, including substantial proposed investment around Myoko and neighbouring Madarao.
As we have argued elsewhere in Uchi Insights, however, future development and current market evidence should remain separate parts of the analysis. A rising official benchmark provides additional evidence that expectations and land values are changing. It does not establish that every piece of land around Myoko will benefit equally, nor does it remove the importance of access, infrastructure, buildability and eventual execution of proposed projects.
Where Is Niseko?
Perhaps the most interesting name missing from the top of the rankings is Niseko. That should not be interpreted as evidence that the Niseko market has become weak. It illustrates the difference between market level and market momentum.
Hirafu remains the highest-priced resort land market within Uchi’s dataset, alongside Karuizawa, while the wider Niseko region has considerably greater visible market depth than Hakuba, Furano, Nozawa Onsen or Myoko. A mature international market starting from a high price base does not need to produce a 30% annual increase to remain expensive and the same goes for Karuizawa, which has been a popular option for Tokyu weekenders for decades.
Indeed, rapid percentage growth may be easier to produce where an area is moving from relatively low historical values towards a new international pricing structure. That distinction becomes increasingly important as Japan’s mountain markets diverge. Niseko offers greater depth and substantially more evidence of established international transactions and pricing. Hakuba currently presents a stronger repricing story. Nozawa displays extreme scarcity. Furano is seeing an increasingly visible premium resort market emerge around Kitanomine. Myoko combines lower present pricing with unusually large future development expectations.
Calling all of these places simply “Japanese ski property” hides more than it reveals.
There Is Also A Separate Transaction-Price Dataset
One further methodological point is worth making because Japan’s property data is often described as though there were a single government database. The Prefectural Land Price Survey is based on professional appraisal of selected benchmark sites.
Separately, MLIT operates a transaction-price information system using information gathered after registered property transactions. Buyers may be contacted and asked to provide details of the transaction, which can then contribute to Japan’s public transaction-price database and broader valuation evidence.
The two systems should not be confused. The benchmark survey is not produced simply by averaging responses from property buyers. Equally, the transaction database is not a complete registry showing the contractual price of every sale in Japan. Each dataset has value, but each answers a different question.
That distinction is particularly important in international resort markets, where off-market transactions, development sales, unusual sites and small annual sample sizes can make seemingly precise averages much less representative than they initially appear.
What The 2026 Data Really Tells Us
There is nevertheless a clear message in this year’s survey. Japan’s mountain-property markets are no longer peripheral to the national land-price story.
For Furano, Hakuba and Nozawa Onsen to occupy the first four positions in Japan’s residential land-growth ranking is significant. For Hakuba and Nozawa to occupy three of the first four commercial positions strengthens that signal further. Myoko’s appearance in the residential top ten widens the pattern beyond the most established international destinations.
It would be equally wrong, however, to turn those figures into blanket statements that “Hakuba land rose 31%” or “Furano property is up 32%”. The correct conclusion is narrower—and more useful.
Specific benchmark sites in some of Japan’s leading mountain destinations are appreciating at rates that place them among the fastest-moving land markets in the country. Independent marketplace evidence, particularly in Hakuba, points in the same direction.
The next question is where within those destinations the growth is occurring, which property types are attracting the demand and how much of the expected future development is already reflected in today’s prices. That is where a national ranking stops being a headline and starts becoming useful property analysis.
Sources
- Ministry of Land, Infrastructure, Transport and Tourism’s 2026 Prefectural Land Price Survey, published in September 2026. It provides the national averages, 21,466-site methodology and specific explanation of the Hakuba benchmarks.
- For the complete national rankings, FNN provides the residential and commercial top-ten tables, including Furano, Hakuba, Nozawa Onsen and Myoko.
- For Furano, the Kitanomine benchmark details and local land-use characteristics are available through the published 2026 benchmark data.
- Uchi’s comparison uses the 2025 Japanese Resort Market Highlights dataset, which identifies Hakuba as the strongest land-price growth market in the Uchi sample while Niseko-Hirafu remains the outright price leader.